E N E R G Y S A V E

Loading

EnergySave by DIDAMIND is the ultimate Cloud platform for industrial energy management. Monitor, analyze, and optimize your assets in real time.


Français
English
  • Français
  • English
EnergySave KPIs and Analysis Calculation Engine

KPIs & Analysis Module (Business Intelligence)

Raw data acquisition is only relevant if converted into actionable performance indicators. The EnergySave KPIs & Analysis module is the processing and transversal decision intelligence engine of your factory, designed to model, calculate, and display your custom performance metrics.

By directly connecting physical energy flows to the financial and industrial logic of your company, this module allows you to audit the efficiency of a process, evaluate the real energy cost of each product, and manage your long-term performance goals.
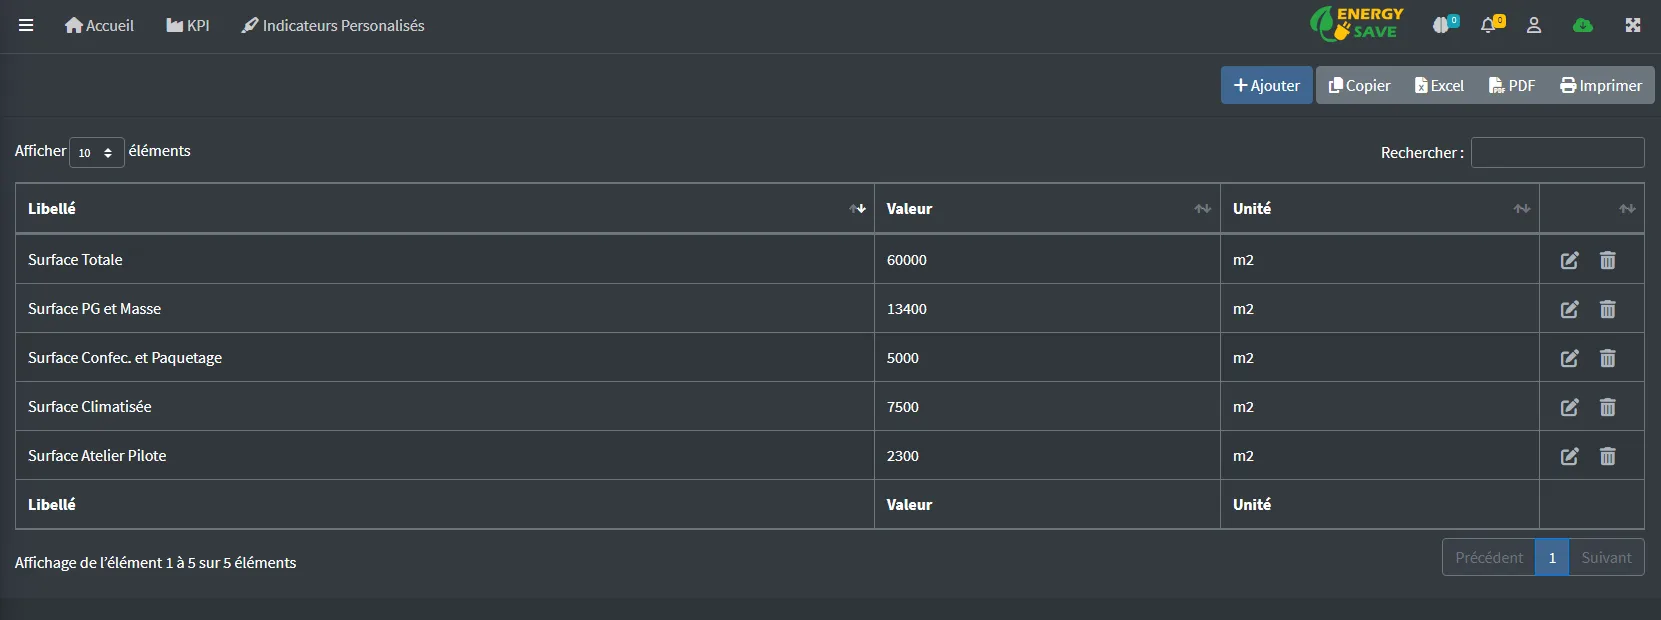
Software Constants Entry Interface

Custom Indicators & Formulas

Model your business rules and
automate your efficiency calculations.

  • Management & Structuring: Granular configuration of your indicators by site.
  • Constants Entry: Integration of purchase rates and CO2 equivalents.
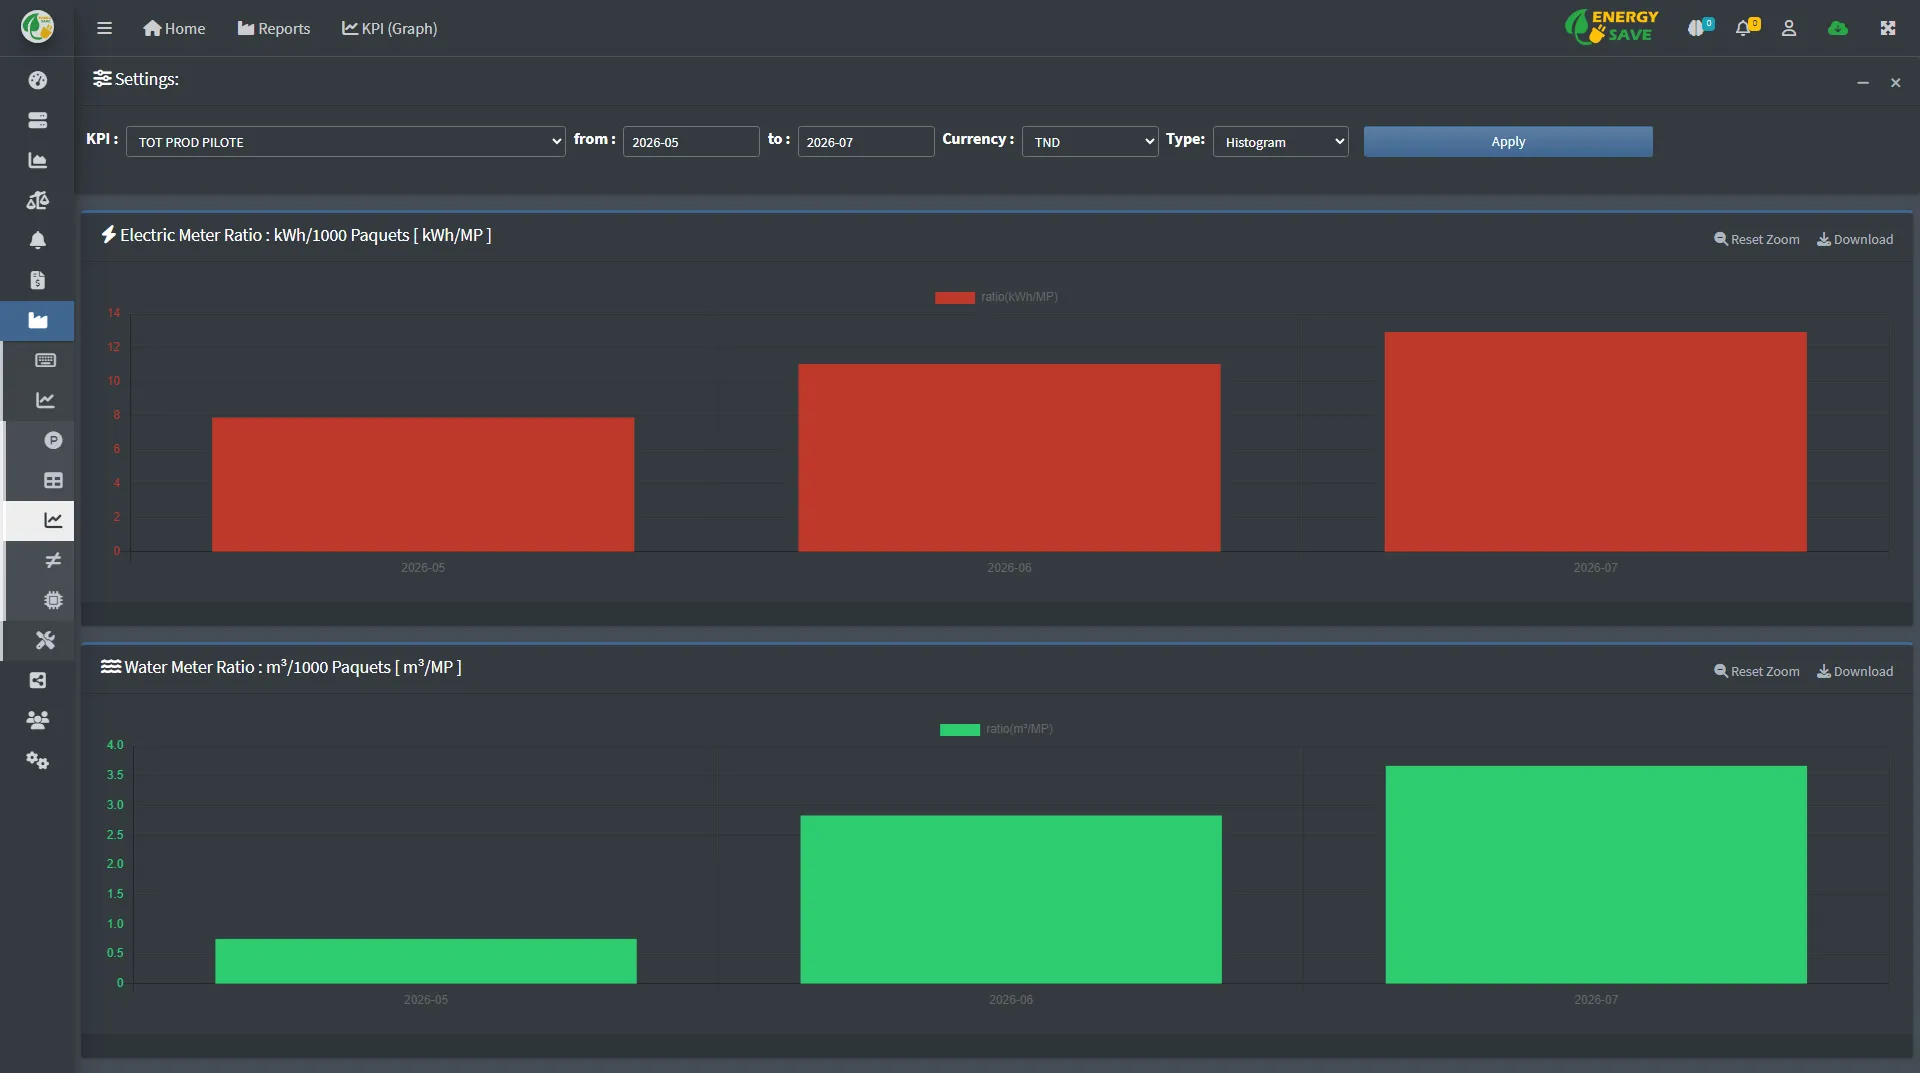
  • Test Profile Tracking: Interactive and analytical trend graphs.

Indicator Governance: Management, Addition & Constants

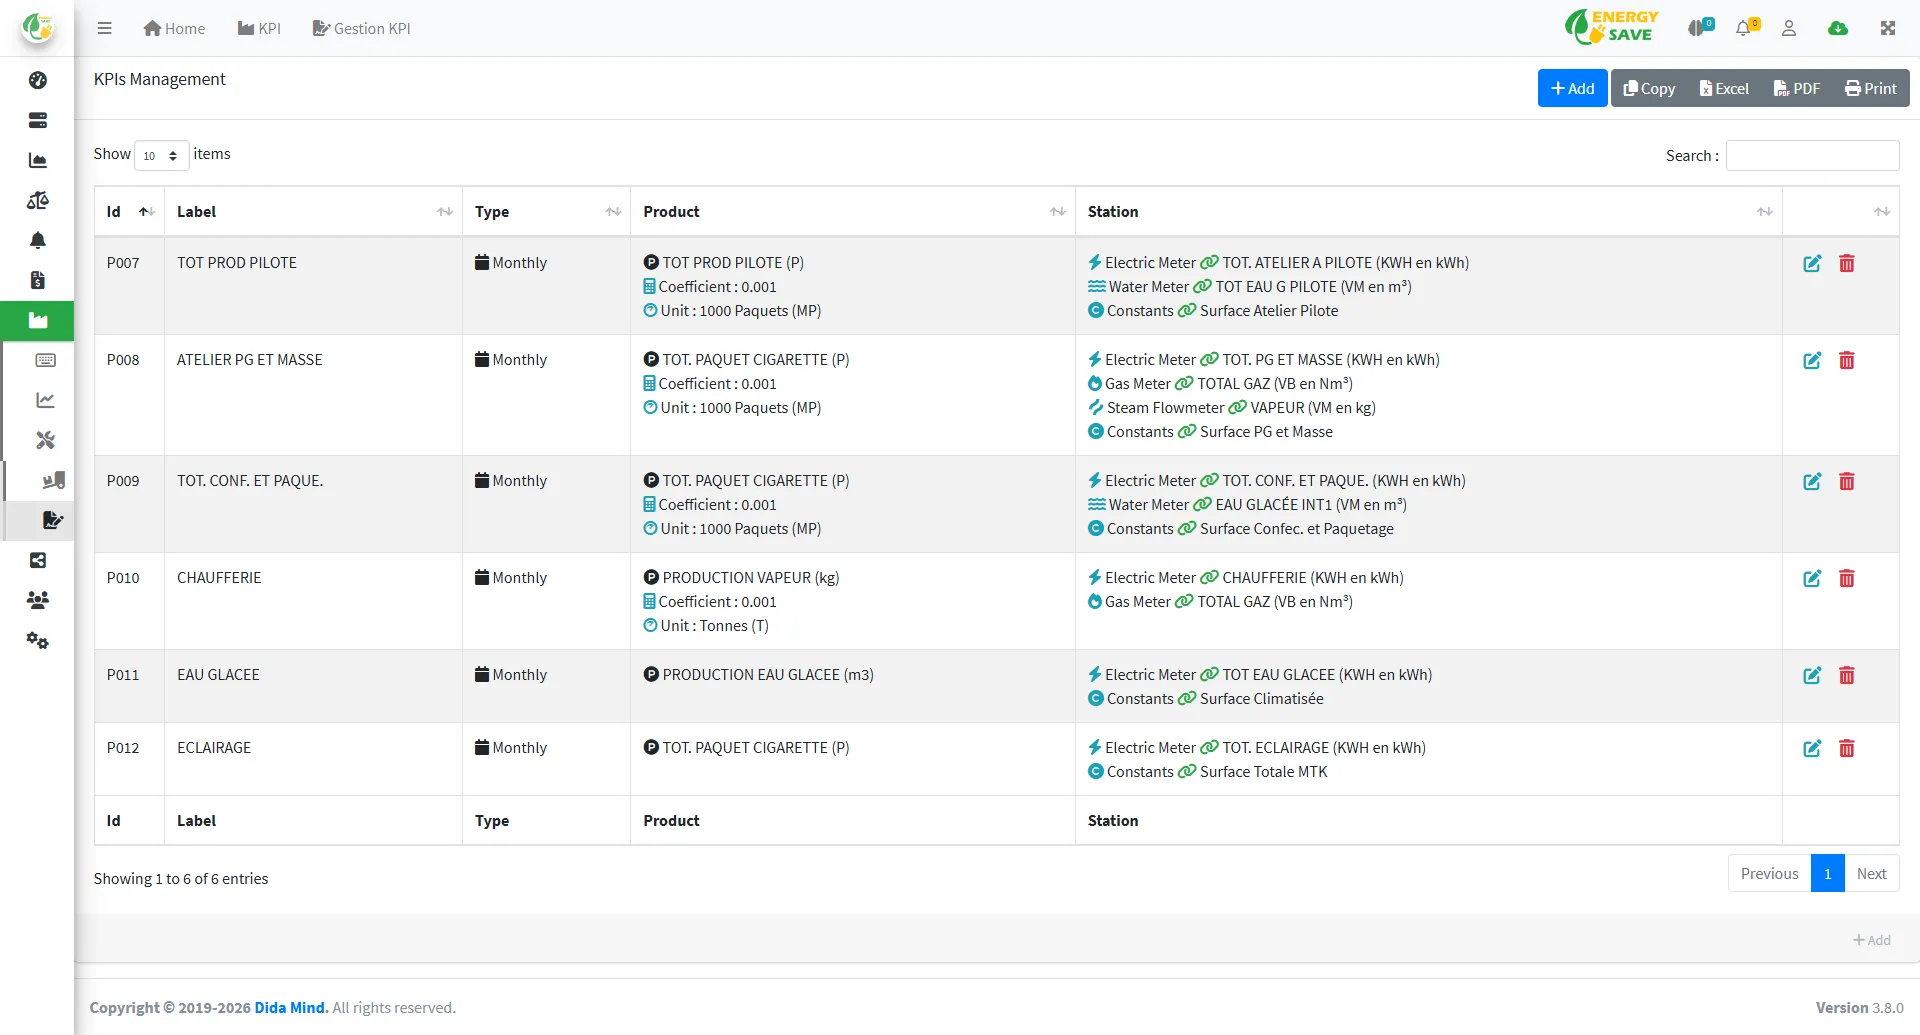
The interface is built around a simplified administration architecture for your energy engineers. The KPI Management sub-module offers a global inventory of your active performance formulas. The Add KPI screen allows you to create complex new mathematical formulas on the fly (for example, summing several sub-meters and dividing them by the production volume extracted from the PLCs).

The Constants Entry panel ensures the financial and environmental flexibility of the system. This is where the operator enters essential external parameters: the unit cost of each fluid (kWh of electricity, m³ of gas), target consumption goals, and carbon equivalence coefficients (kg CO2 / kWh). The platform thus automatically updates your cost indicators and your CSR environmental footprint.

Industrial Production Tracking & Control (OEE)

The Production Control sub-module is the true operational dashboard for workshop managers. Designed to cross-reference your energy data with machine activity, it provides an instant and historical x-ray of the status of each production line.
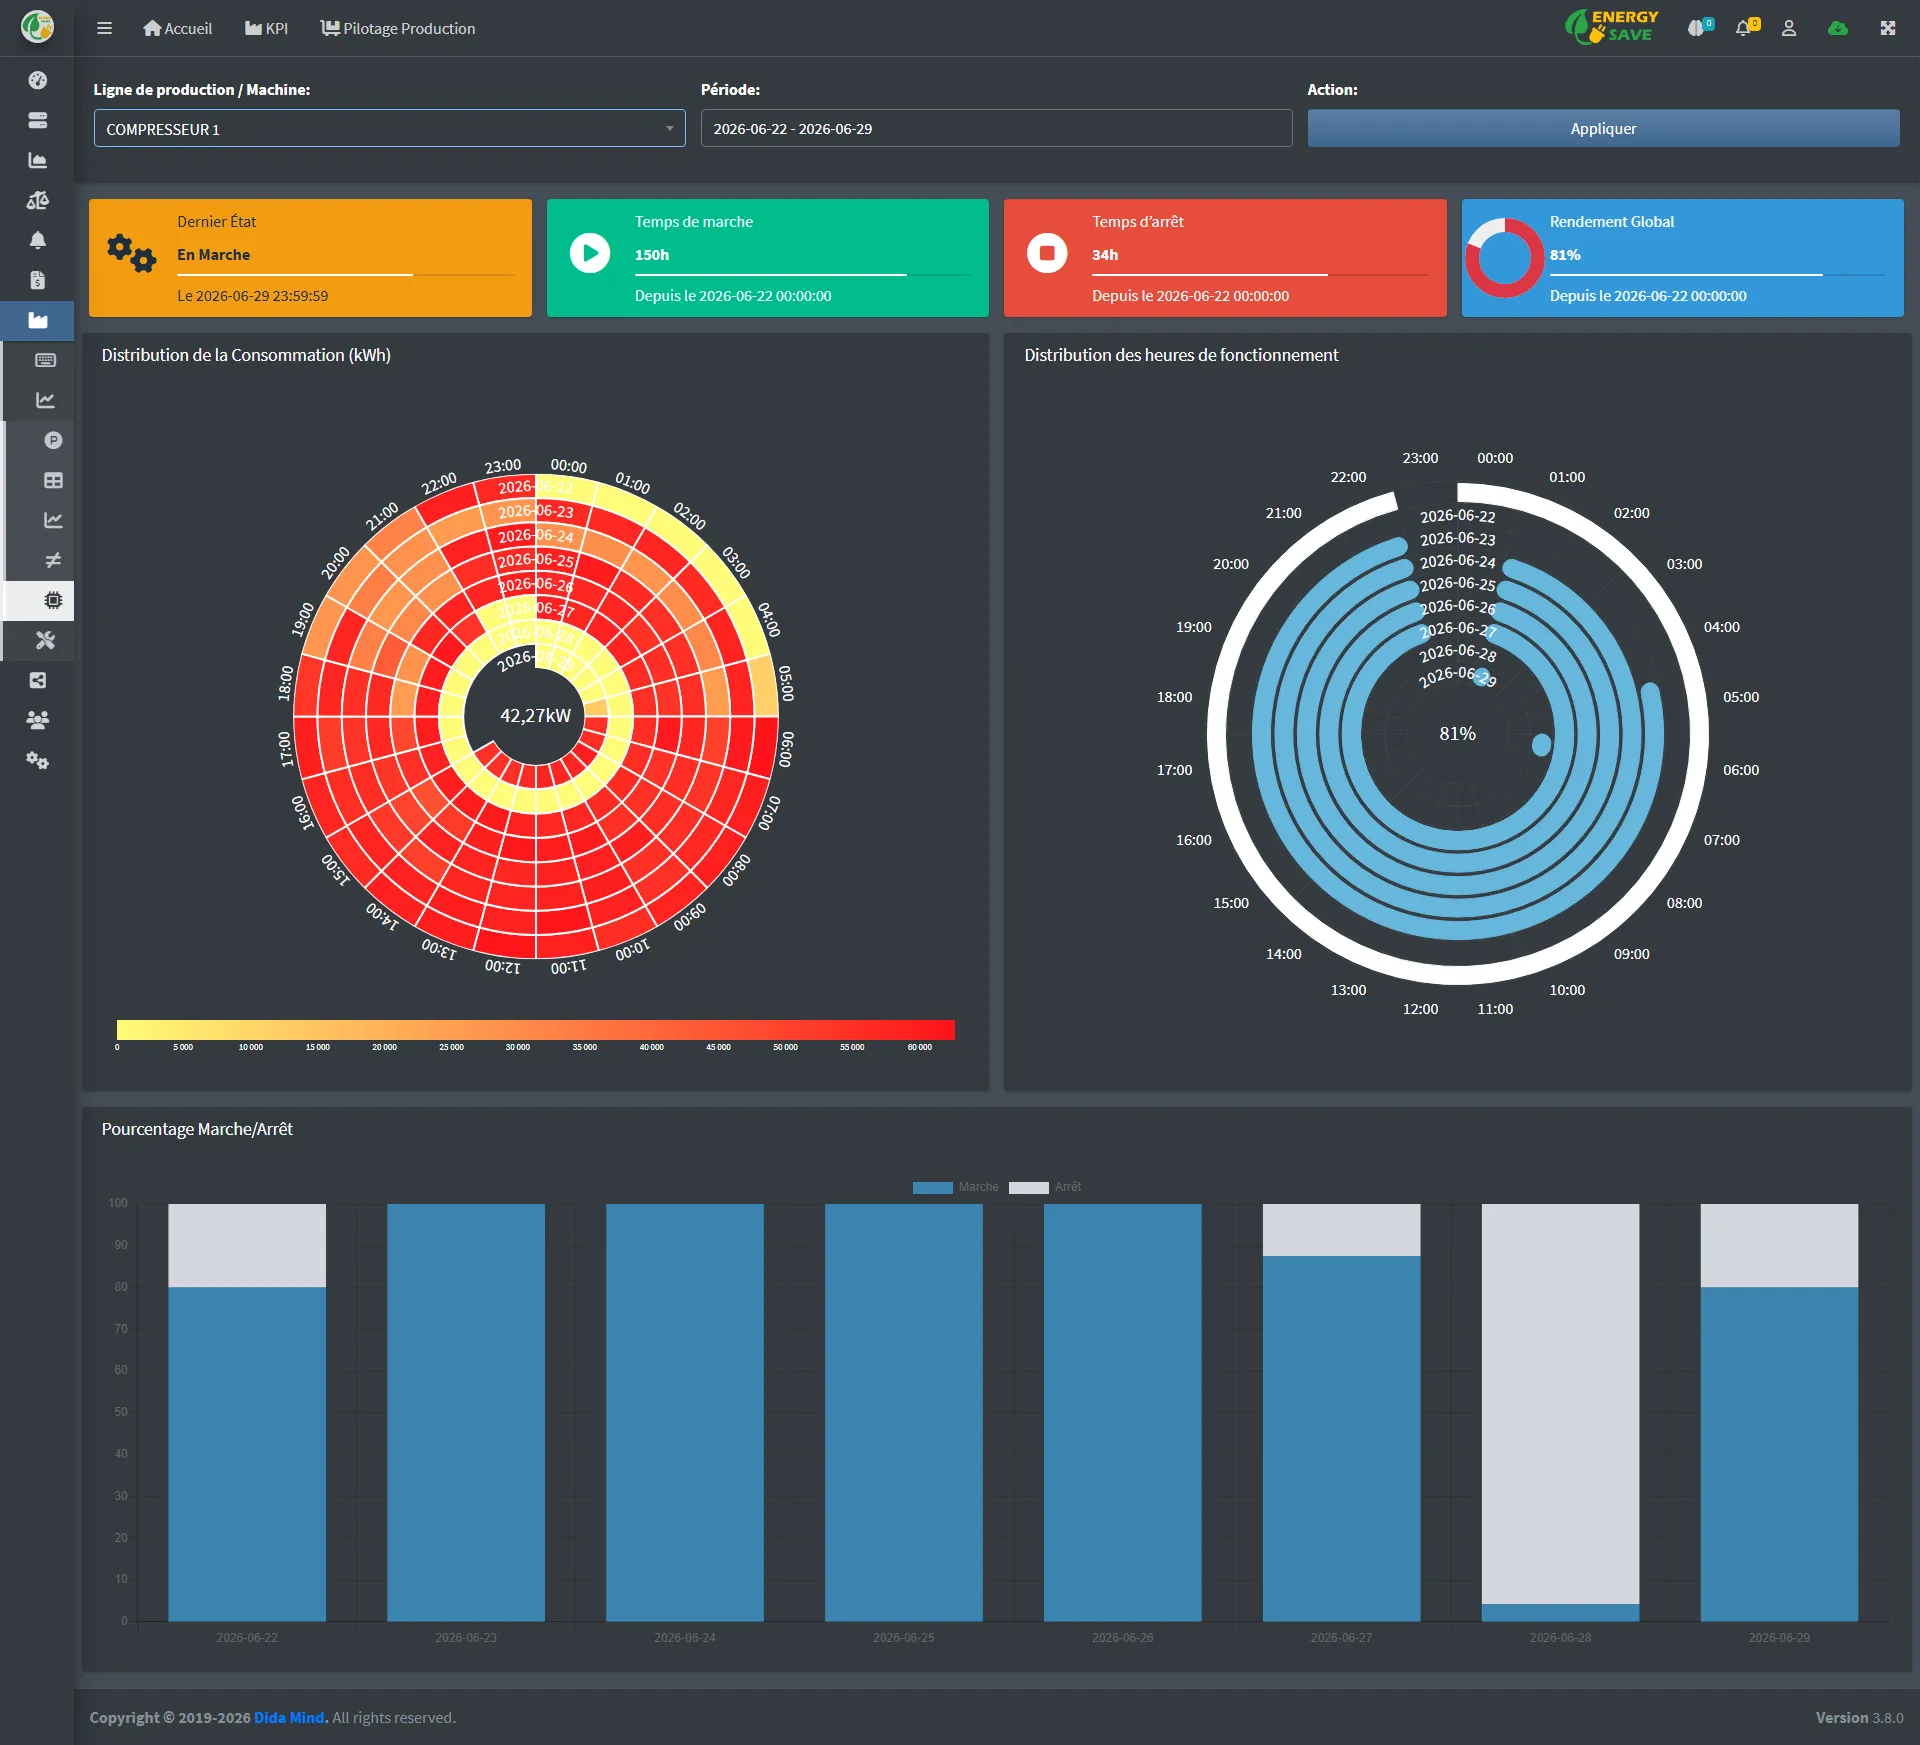
Production Entry and Control Interface

Workshop Performance Indicators

Correlate your workshop data for optimal energy performance.

  • Status and Yield (OEE): Dynamic widgets display the last known state of the line (Stopped / Running), the exact accumulation of Uptime and Downtime over the selected period, as well as the Overall Equipment Effectiveness reflecting the tool's efficiency.
  • Circular Mapping: Ring charts (Sunburst/Radar type) illustrating the hourly distribution of consumption and operation over 24 hours. Instantly identify activity peaks and the most energy-intensive hours.
  • Activity Profile: A histogram chronologically traces the proportion of effective production time against inactivity times, facilitating the detection of under-productive days.

Frequently Asked Questions (Analysis & Yield)

Understand how to structure your analysis tools to drive your performance.

This screen allows you to enter stable or contractual reference values, such as the purchase rates of your energy or your target OEE (Overall Equipment Effectiveness) goals. These constants are seamlessly injected into your calculation formulas to translate your physical consumptions (kWh, m³) into real financial costs and efficiency gains.
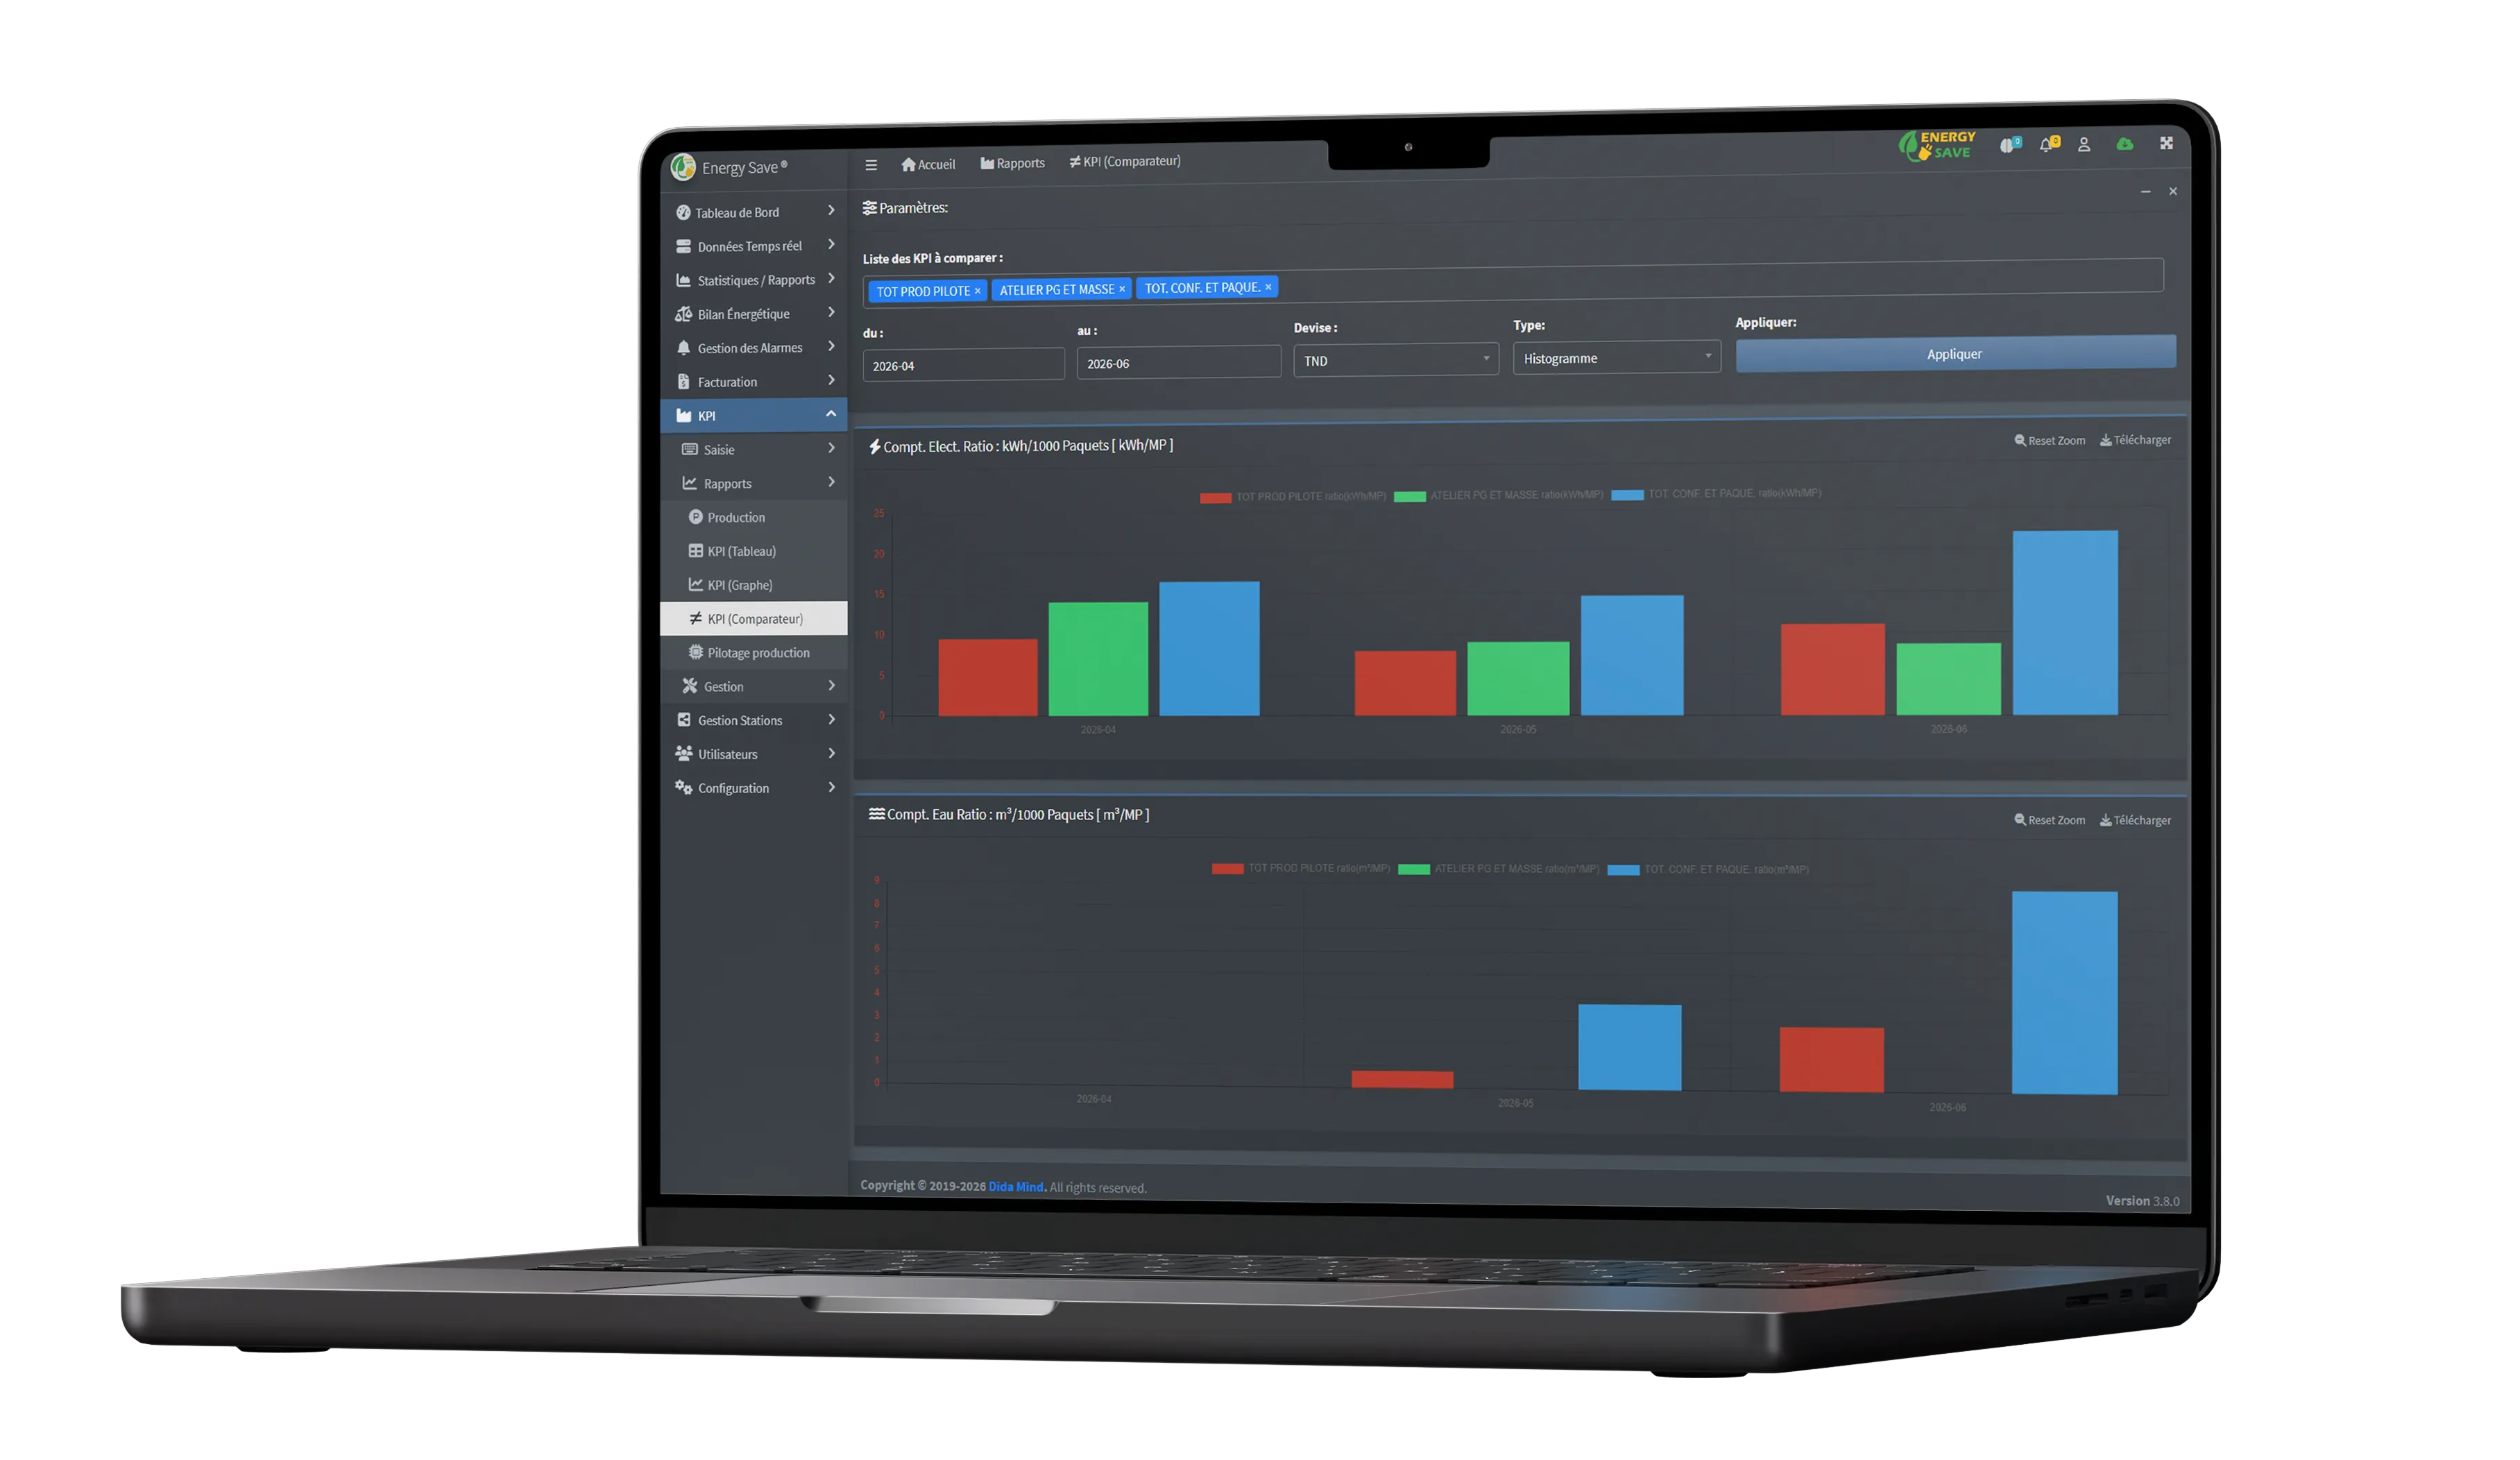
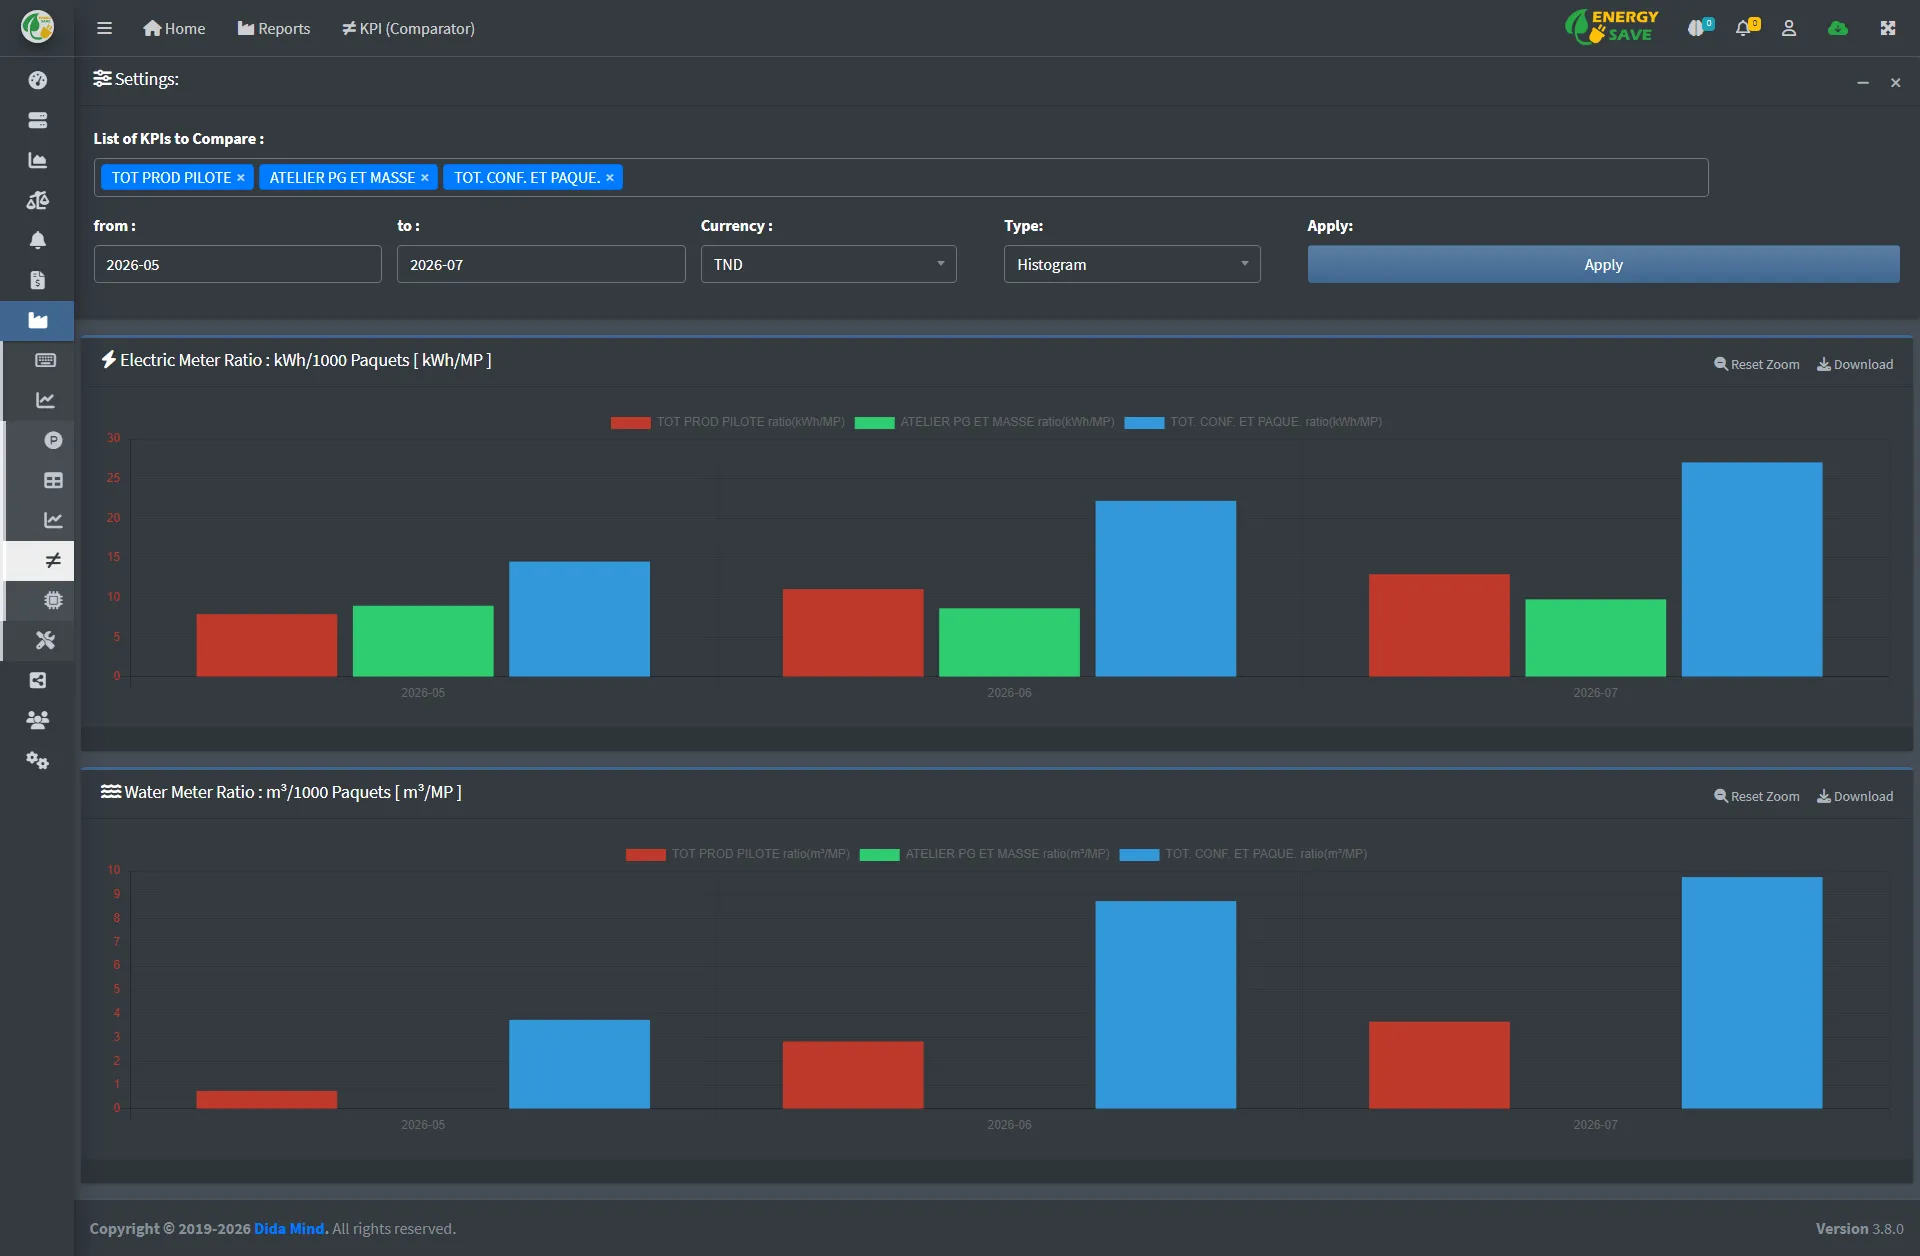
The Chart Comparator is our most advanced benchmarking tool. It allows you to overlay multiple variables on a single interface (e.g., electrical power of two separate compressors) or to analyze the behavior of the same equipment over two different time periods, making it ideal for validating the ROI of a maintenance action.
Absolutely. As soon as a custom KPI is created and validated in your administration space, it natively integrates into the platform's ecosystem. You can query it in the history, add it to your dashboards, or export it instantly in a single click in any standard format (Excel, PDF, CSV).